[Disclaimer: I’m British and trying to talk about the NFL, so it’s pretty likely I’m going to sound like either an idiot or an alien while trying to describe what’s going on here, my only request is that you send abuse using the anonymous field at the bottom which goes straight to my email instead of the comment box which everyone can see]
Imagine walking down the street and someone with a clipboard and a bored expression asks you the question “How many glasses of water did you have in the last week?”. You probably don’t really know the answer, and the person asking doesn’t really give too much of a crap. Maybe you could guess at any number between 30 and 40 glasses of water with an equal amount of belief, but you have to choose a number – are you just as likely to choose 32 as 35?
Maybe not, and in the NFL when the guy with the ball gets tackled or stopped at the end of a run and the officials only get a few seconds and a compromised view to decide where it stops, Will every yard line be treated equally?
What I’ve got: A spreadsheet containing every single play run in the NFL from 2000-2014 (500,000 in all)
What I’m going to do with it: Show that the referees subconsciously change the outcome of a play based on where the painted lines are on a field, and subsequently show that it doesn’t matter.
OK let’s go, first off for the football illiterate, a walkthrough of all the words you won’t know that are important in this post. (skip to next horizontal line if you don’t need me to explain what a play is)
American Football is based on a series of plays. A play is started by the offense taking the ball and either deciding to run with it or pass it to another player down towards the opponent’s endzone. The play finishes when the player holding the ball:
- Is tackled by the defence
- Runs off of the field
- Throws the ball to someone who doesn’t catch it
- Has their motion stopped by the defence.
For 1, 2 and 4 the next play then starts where the ball was when that event happened. However 1 and 4 often look like this:
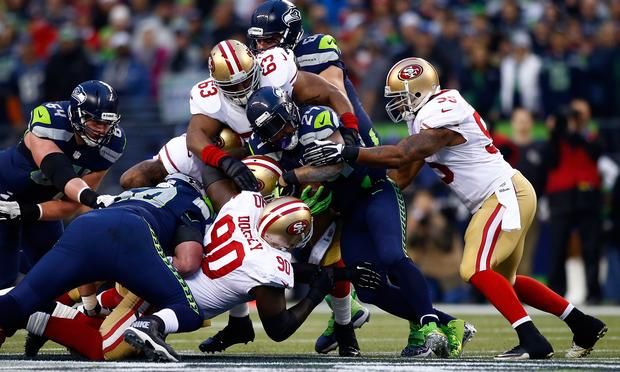
Can you see the ball? You can take some time if you’d like. The situation above usually starts and ends within a second, and the officials (referees to those who follow soccer) need to get the ball and place it down on a yard line within a few seconds. This is the spot of the next play.
Also relevant to our discussion is the gridiron. This is a colloquial way to refer to the markings (required by regulations) on an official NFL field. It look like this:

so in a play you will start at yard x, and go y yards – then on your next play you will start at the x+y yard line – in most cases you will start at a yard line such as 1,2,3,4,…,99 even though the only ones marked out by full lines are 0,5,10,15,..,100. The game of football is then essentially a slow crawl to the opponents end of the field.
Relevant later is the scoring. The two main ways to score are to walk into your opponents endzone (the darker green at the end of the gridiron) – that’s known as a touchdown and is worth 7 points. The second is to be able to kick the ball between the posts at the end of your drive, which is known as a field goal and is worth 3 points.
Okay, I can breathe now safe in the knowledge I haven’t alienated the vast majority of people who might read this. Let’s move on to the interesting part of this post.
The first thing I decided to do when I picked up the spreadsheet with these half a million plays was to ask the question where do plays start from?
So I took every single play in the 14 year dataset, took its starting position and plotted a bar graph. Here it is:

For those of you who realised that my explanation of football above was incomplete, or realise from this graph, an important point is that most of the collections of plays (known as drives) start from the 20 yard line, and the offense can lose the ball if they don’t move it upfield fast enough. This explains both the large peak at the 20 yard line and the smooth decline from 30 down to 100 (the opponents endzone) as the offense has to give the ball to the other team.
In fact, this graph is 90% completely inane and what you might expect. Drives start, some drives finish in midfield (30-60 yard line) and some drives make it all the way to the end (100) in which you have a tense goal line battle (see the peak at your opponents 1st (99th) yard line). What is less easy to explain though is the very sharp peaks which jut out above the smooth curve. I assumed these peaks were my fault and messed around for ages to get rid of them, but I just couldn’t shake them. Then I took this graph and compared it to the lines on a gridiron like so:

Every single one of those staccato sharp peaks occurs on a line which is drawn on the field. This isn’t a small effect, on the 40 yard line this deviation is around about 20%. And it isn’t due to a lack of data, the average deviation from the ‘true’ distribution for a dataset this large should be around 1%, so this is highly statistically significant.
So what could it be? The first thing that came to my mind was that perhaps football teams preferentially run plays which are based around the yard lines. Say instead of just running five yards forward, run to that next line across the field and I’ll chuck it to you. Or maybe there’s a conscious effort by a player to reach for a field line when they see one. Those two sound about reasonable until you consider that if someone was to receive the ball at the 30 yard line, they’re going to run in either direction until they get tackled, which means that a play that was based around the 30 yard line might end up at the 31 yard line, or the runner who is reaching for the 30 yard line might just miss and get the 29. The effect of this on that graph would be to spread out the peak across a few yards, but we instead see a perfectly sharp peak.
The only explanation that has stuck with me is that when a official thinks “oh damn this is a mess, there are seven separate six foot tall millionaires all piled up on top of the ball and I have 100 rules to try and remember, where did that ball stop?” their subconscious makes them grab for the safety blanket of a line drawn and place it down on there.
This is known as Statistical Heaping and is a well known effect for respondents of surveys. It is the act of choosing a number you’re more comfortable with in the range of values you think it might be, is the number between 8 and 12? Just say its 10. For example take this graph of the birth weight of babies in Tanzania taken from this link:
 You see that either you are to believe that the babies weights are being reported as round numbers to save time, or something is happening where you can only produce babies with a multiple of 500 grams.
So if it is true and we’re to believe that the referees are favouring putting the ball on the yard lines – what does it mean? We see that the peaks are far more pronounced by midfield, and when you get closer to the goal line they almost entirely disappear, this makes it seem like the referees are paying closer attention near the goal line because they know it’s more important.
Why is it more important, isn’t a one yard gain a one yard gain? Well to work this out I made a graph of the average amount of points scored based on where the team is on the field. This means that for every yard line I took all drives that had at least one play that started on that yard line, and then did an average over all their points. Shown below: (N.B. 7 points for a touchdown, 3 points for a field goal)

You can see that in the area where the peaks on the painted field lines are most pronounced (30-50 yards), the extra yard on average makes little difference to the outcome of the drive, however when you get close to the endzone between 80 and 90 the difference in one yard is quite significant – this is why the referees are being extra careful.
To sum up: are referees biased in where they place the ball? Yeah, probably. Does it make a difference to a football game? Not really. I feel like there might be something I’m missing as this hasn’t been brought up before to my knowledge, so if you know why this is wrong please hit me up below.
Further unbelievably complex reading on statistical heaping can be found at: Sex, lies and self-reported counts.
Follow me at my shiny new ‘semi-pro’ twitter @JoeyMFaulkner

Reblogged this on sonofbluerobot.
LikeLike
Interesting the cut back in the average points scored in the 60-70 yard range, I’m guessing because it’s around the edge of FG range. Would this imply that teams should take fewer FG attempts from that range/go for it more often on 4th down?
LikeLike
There’s two things to consider when deciding whether to attempt a field goal: the *expected* number of points earned and the *variance*. Choosing to attempt a FG from this range might earn fewer points on average, but it’s a safer play. Choosing to make a play is high risk, high reward. If the difference in expected points earned from attempting a FG versus not attempting is small, it could make more sense to go for the safe play rather take a big risk for maybe a few more points; a bird in the hand is worth two in the bush.
LikeLike
Yes, they should but it has nothing to do with this phenomenon.
LikeLike
Not really helpful. What phenomenon does it have something to do with?
LikeLike
I’d think part of the deviation, particularly close to the 20-yd line, is due to fouls. These are enforced by means of a yardage penalty, usually in multiples of 5 yards. So, for example, a kickoff which results in a touchback, but where someone in the kicking team commits a personal foul (15-yd penalty), would have the receiving team starting from 35.
LikeLiked by 3 people
I am a football official and I can explain. You are correct about the bias. You are correct that it has little affect on the outcome of the game. However, you are incorrect to assume that the ball is placed on yard lines subconsciously. It is done intentionally.
The reason for this is because of the first down markers. The offense must gain 10 yards within 4 downs to keep the drive going and maintain possession of the ball. Markers connected by a chain 10 yards long are used to designate the yardage the offense must gain to obtain the first down. If the offense is close to the first down, officials use the chains to determine whether they made it or not. Sometimes this involves bringing the chains on the field and actually measuring.
I’m here to tell you, the officials hate having to measure for first downs. It disrupts the game, is extra work for them and takes up their time. So whenever the ball is close enough and they can get away with it, officials will place the ball on a yard line. This ensures that the 10 yard marker needed for a first down will be on a yard line and make the officials’ jobs easier.
This also explains why the bias disappears when the ball is near the goal line. Once the ball is within ten yards of the goal line, the offense cannot obtain a first down. Therefore, the chains are not needed. Because of this, the officials receive no benefit from fudging the spot of the ball.
Hope this helps you.
Stinky Whistleteeth
LikeLiked by 3 people
You don’t even like feetball, I’m the number one super fan!
LikeLike
Two corrections in relation to people’s views on the officials. Firstly it’s not the rules that govern where balls get placed, it’s the mechanics. This is the officials bible on where to be and what to look at for each officiating position on the field. In terms of ball placement there are three positions in relation to each yard line. Nose of the ball on the line, tail on the previous line and half way between (as has been discussed at length, the people who record the stats don’t have that granularity!). If the play ends close to the line to gain then the exact position of the ball is used and the chains are moved to the ball to ensure accurate measurement. Secondly the people who are assessing the location on the end of the play are generally the officials known as the wings (Head Linesman and Line Judge (there are some exceptions by distance and type of play)), depending on how far the play went their view on the angle won’t be exact as they will be trailing the play slightly. Again there are exceptions in the mechanics such as plays on the goal line and plays where a close first down call is likely to be needed, when they will get to the line first and come back to the end of the play if necessary. If it’s a longer play then the fact that it ended up 12 or 13 yards past the line to gain isn’t that important as you are still then trying to gain 10 yards on another 4 attempts. Also in terms of initial placing to start each set of 4 downs, beginning on a yard line (not a 5 or 10) makes it relatively easy to judge if a new set of downs has been gained and aids the flow of the game (rather than using the exact spot which then makes it more likely the chains would be used/needed).
LikeLike
Nitpick, but touchdowns are worth 6 points. Cool article though.
LikeLiked by 1 person
I think a lot of it has to do with penalties. If you have the greatest number of plays on the 20 from the kickoff, many times there will be a penalty from this place, which most of the time is going to either add or subtract 5 10 or 15 yards. This is also why you see spikes on the 10 and 15 yard lines – a lot of offenses immediately will false start or get a holding penalty, pushing them back. On the other side, a defensive offside or unsportmanlike penalty is 5 or 15 yards, but there aren’t a ton of 10 yard defensive penalties. So that’s why you’re seeing a bigger peak at 25 and 35 compared to the 30. And the 40 yard line is where the ball starts if the kickoff goes out of bounds. So that’s what I am seeing here, but you could also be right.
LikeLiked by 1 person
Also, pass interference in the end zone will result in the ball being placed on the one yard line (or 99 as the article says) explaining why there is a spike there.
LikeLiked by 2 people
The one yard line is also the most scrutinized spot on the field. When a player is given an extra yard on the official spot when really being down at the one (and thus awared a touchdown) it is often overturned on replay and placed back at the one. A player given an extra yard from the two to the one (or anywhere else on the field) is never corrected unless it is the difference between getting a first down or not. Also, the one yard line is quite wide, since anything behind the one but close (potentially back to the 1.5 yard line) is still reported as being at the one yard line.
LikeLiked by 1 person
Anecdotally, I don’t buy the ball placement bias from the officials. I can’t recall a single time I’ve been watching a game and thought “wow, they biffed that spot by over a yard”. If that were the case, we’d expect frequencies at, for example, 49 and 51 to not only be lower than at 50 (true) but also lower than at 48 and 52 (not true) because those placements are being rounded off to 50.
The giant spike at 20 is clearly due to touchbacks. Big spikes at 10, 15, 25 and 30 are impacted by penalties (ex: touchback followed by false start, offsides, holding, … ) . The likelihood of penalties adding up and keeping plays on the x0 and x5 yard lines going down the field falls rapidly. I believe the big spike at 99 is not due to defensive penalties, but rather playcalling. Anecdotally, teams on the 99 will frequently run it and fail to score, thus getting another play from the 99. In other words, once a team is on the 99, they often run subsequent plays from the 99. This gives us a hint: perhaps it’s the playcalling choice. Maybe teams are more likely to throw the ball when on a multiple-of-5 yard line. Throws fail about 35% of the time, thus about that often there will be a next play from the same yard line. The spikes are not remotely this big, so even a partial bias towards throwing in these scenarios would accomplish the spikes. Runs, gain exactly zero yards far less frequently.
I think the lone play where placement is really somewhat arbitrary and prone to placement bias is out-of-bounds punts. I’ve noticed those are always placed on an exact yard line, perhaps a multiple of 5 is chosen more often. Such punts account for a few plays (out of ~150?) per game, so they could impact the stats, but not to the degree we see.
To confirm (or deny) my theory, the same dataset should be analyzed for frequency of called run vs pass as a function of ball placement, or the dataset should be filtered only for plays where placement is at the discretion of the official: remove touchbacks and plays following incomplete passes or penalties. That would be the real test of how officials spot the ball.
LikeLike
The mechanics for deciding on the spot where a punt goes out of bounds use correlation between the view of the referee (white hat) to get ball trajectory and the intersection of the out of bounds line as held by the wing official. The wing moves down the line and looks for the referee to indicate, stopping when the WH signals. As discussed this may not be precise but is unlikely to favour the main lines as the WH would be far enough away not to see them clearly and the wing isn’t choosing the line. The placement on an exact yard line goes more to the ease of assessment of the line to gain if starting from a line that’s clear to see, doesn’t matter if it’s A line or a 5/10 yard line.
LikeLike
Right, I don’t get the sense that the ball actually ends up on a x5 or x0 yard line more often after an oob punt. I just wanted to call it out as the one place where officials could reasonably be more than a yard off from the reality, and thus perhaps subjected to placement bias. But even so, there’s not enough volume of oob punts to account for what we see. My money’s absolutely on playcall bias 🙂
LikeLike
I think that’s a really interesting finding
I think you explanation sounds generally correct,
I have an idea that you might want to check that might test your hypothesis further
if the theory is that they pay more attention when they closer to the goal line, the effect is probably similar when they’re spotting the ball close to a first down (rather than a relatively low impact down like a 2nd 7)
you could run the data for just plays where the next play is a 2&1, 3&1, 4&1, 1 &10 where is 10 or 11 yards from the previous 1 & 10 (implying that they just made the first down), or a turnover on downs 9 or 10 yards form the other teams previous 1&10 (implying that they just missed a first down)
if you check for the spots on high impact downs and in fact the effect smooths out
it would seem like that would support the idea that they’re just putting on the big lines out of carelessness
——————————–
antedoctally, it does seem like there is more questionable spotting on low impact downs that aren’t right around a 1st down (that’s entirely antedoctal though
anyway, really interesting post
LikeLike
Once you have filtered the data to include only plays in which the referee actually spots the ball (i.e. no plays following a touchback, penalty, or incomplete pass), we still cannot be sure that the bias is in the placement of the ball: it may be in the reporting of the field position. The officials on the field are able to spot it at fractional yard positions, but the data entry person responsible for this dataset is only returning whole number field position. So, for example, when the ball is spotted at the 19.5 yard line by the official, there is a person watching the game (likely via TV broadcast) entering this position as either 19 or 20. I find it more plausible for this person to be influenced by the painted lines on the field than the referees.
LikeLiked by 1 person
Hi Joey and thanks for the interesting data.
I had to look twice before I realized what was going on. I read through the comments to make sure no one else has submitted the same explanation. I am pretty sure I have the answer (or at least part of the answer), and I will explain below.
1. I am sure everyone agrees that the 20-yard line spike is due to touch backs, which is when the ball goes into the end zone on a punt, kick-off, or short field goal.
2. The 99-yard line is due to the fact it is more difficult to advance the ball from that point, so you see teams run multiple successive plays from that point on the field than in other positions on the field. This is also explained by some of the other comments.
3. All of the other spikes on the painted lines 5 yards apart, I believe can be explained also. First off, I want to comment on the referee’s comment. I have watched NFL football for over 40 years religiously, and I wasn’t aware of officials bias on the painted lines. I doubt very much that NFL officials are biased when spotting the ball. Maybe a very small amount of bias could be used in order to avoid measuring for first down. I guess in high school and youth leagues, this may be more present. But in the NFL, I doubt that it really exists. Those guys are trying their best to get that ball within a few inches of where it belongs, and if they are biased to use those lines, that bias (I am fairly certain) is not enough to cause the spikes you are seeing.
The thing you are missing is that once the ball is spotted and move to the center of the field, someone somewhere has to record where the previous play ended and thus where the next one starts. I believe someone is manually entering a number into a computer. I don’t know if this person is part of the official NFL crew, or is like a clock keeper you would see at high school games. My guess is that the NFL has an assigned statistician for every game.
His job is to record each and every play to a specified amount of detail (incomplete pass, or complete pass from QB x to another player y for a gain of so many yards, or a run by player x for so many yards, etc.) and record what yard line each play was started from and where it ended. They do not record yards gained with real numbers. They use integers. So the guy doing this rounds the nearest yard line to the end of the play, which will also be used for the start of the next play.
Therefore it is the bias of the statistician that is the reason for the spikes. For example, if the ball is placed halfway (or close to halfway) between the 31 and the 32, the statistician will choose either the 31 or the 32. So let’s say half the time he chooses the 31 and the other half he chooses the 32. This causes no spikes on either yard line. Same thing happens between the 32 and 33. Same thing happens between the 33 and 34.
But between the 34 and 35 and also between the 35 and 36, he usually will show some bias and pick the 35 more often than not. The reason for this is probably exactly the same reason you had surmised for the referee’s bias. He sees the line. It is very close to the line, it is easy for him to record the 35 in both cases. I can see that this type of bias would definitely create a spike on the 35.
However, it seems it would also create a little dip on the 34 and the 36, and I am not sure your data shows that. It appears there are a few dips in some of the yard lines next to a painted lines, but not enough to verify this theory. Maybe there are other biases involved also?
But an important point to realize is that the bias of the statistician has not bearing on the game whereas a referee’s bias would affect the game in either a small or possibly a large way. But statisticians are only tracking statistics. And statistics are used for game planning, fantasy football, etc., but they do not affect the game being played in any way at all.
Cheers!
Don
LikeLike
I think you’re on to something. Penalties do account for some of the reason for the painted line bias, but not all of it, I’d bet. Something else to consider is that offensive coordinators may call plays they designed to get just far enough for the first down. So if you start at the 20 and end up with a 3rd and 4 from the 26, you may call a pass play that has a receiver running right to the 30 but no further because that would be unnecessary risk. And then you start the next 3 downs from the 30 and need to get to the 40. The likelihood that these exact 10 yard increments would be possible as you matriculate the ball all the way down the field is unlikely and that could be why the spikes get smaller and smaller as you get towards the right of the graph.
Great post.
Cheers!
LikeLike